Monthly Market Intelligence Report

California Real Estate Market Analysis - July 2026

Reporting PeriodJuly 2026
Data CurrencyThrough June 30, 2026; rates through July 23, 2026
Primary SourcesC.A.R., NAR, Freddie Mac, Census/HUD, ATTOM, BLS, LAO, Zillow
Executive Summary
01
The inflation scare faded. Headline CPI (the Consumer Price Index, the standard measure of consumer inflation) fell to ▼ 3.5% year over year in June from 4.2% in May, as energy prices reversed. Core CPI, which excludes food and energy, eased to 2.6%. The June spike now looks like an energy shock rather than a broadening of inflation (BLS, released July 14, 2026).
02
Rates did not follow inflation down. The 30-year fixed rate averaged 6.58% in the week of July 23, up from 6.55% the week before and from a 6.43% reading on July 2, though still below 6.74% a year ago (Freddie Mac). The Freddie Mac monthly average was 6.49% in June, up from 6.44% in May.
03
California sales hit a six-month high. Closed single-family sales reached a seasonally adjusted annual rate (SAAR) of 279,880 in June, up ▲ 4.1% from May and ▲ 6.0% year over year, the strongest annual gain since September 2025. Gains were led by entry-level and mid-tier homes (C.A.R., released July 16, 2026).
04
The California median stepped back from its record. The statewide median for an existing single-family home was $904,640 in June, down ▼ 2.8% from May's record $930,260 but up 0.4% year over year and above $900,000 for a third straight month. The decline tracks a drop in the million-dollar share of sales from 38.5% to 36.9%, not broad price weakness (C.A.R.).
05
Supply tightened again. California's Unsold Inventory Index (UII) fell to 3.1 months in June from 3.8 months a year earlier, and active listings dropped 10.4% year over year, the fifth straight annual decline and the largest since December 2023 (C.A.R.).
06
California distress is now measurable, not just directional. ATTOM counted 21,543 California properties with a foreclosure filing in the first half of 2026, up ▲ 12.8% year over year, including 16,040 foreclosure starts (third nationally) and 2,644 bank repossessions (second nationally). Bakersfield had the fourth-worst metro foreclosure rate in Q2 (ATTOM, July 16, 2026).
07
Forward demand softened. NAR's Pending Home Sales Index fell 5.4% in June to 72.5, its lowest since January, and existing-home sales slipped 2.4% to a 4.09 million SAAR even as the national median hit a record $440,600. Contracts signed in June become closings in August and September.
National Overview
30-yr fixed rate
6.58%
▲ from 6.55% wk prior (Jul 23)
National median price
$440,600
▲ record high; +1.8% YoY
Existing home sales
4.09M
▼ −2.4% MoM; +2.8% YoY
National inventory
4.6 mo
Below balanced (5 to 6 mo)
Pending sales index
72.5
▼ −5.4% MoM; 6-month low
Fed funds target
3.50–3.75%
Held June 17; cut removed from dots
CPI (Jun '26)
3.5%
▼ from 4.2%; core 2.6%
30-year fixed mortgage rate, June 2025 to June 2026
Freddie Mac monthly average
Source: Freddie Mac Primary Mortgage Market Survey, monthly averages through June 2026. Latest weekly reading 6.58% (July 23, 2026).
National existing home sales (SAAR, millions)
Sales SAAR
Source: NAR Existing-Home Sales, seasonally adjusted, through June 2026 (released July 9, 2026). NAR revises prior months, so month-over-month changes implied by this chart can differ slightly from headline percentages.

Last month's inflation scare has largely unwound. Headline CPI fell to 3.5% year over year in June from 4.2% in May, and the index actually declined 0.4% on the month, with energy the largest single contributor to the drop (BLS, released July 14, 2026). Core CPI eased to 2.6%. That combination supports the reading we offered last month: the May spike was an energy event, not a broadening of price pressure.

Mortgage rates have not cooperated. The Freddie Mac 30-year fixed averaged 6.49% in June, up from 6.44% in May, and the weekly survey has since climbed from 6.43% on July 2 to 6.49% on July 9, 6.55% on July 16, and 6.58% on July 23. The Mortgage Bankers Association's separate survey put its 30-year contract rate at 6.65% for the week ending July 10, the highest since August 2025, and reported mortgage applications down 2.7% on the week. The gap between the two surveys is a matter of loan mix and methodology, not a contradiction, but both point the same direction.

The Federal Reserve held its target range at 3.50% to 3.75% on June 17 in Chair Kevin Warsh's first meeting, in a unanimous vote. More consequential than the hold was the Summary of Economic Projections: officials removed the rate cut they had previously penciled in for 2026 and left the door open to a hike. For borrowers, this means the long-anticipated relief from Fed easing is off the table for this year.

National activity is drifting sideways with a softer edge. Existing-home sales fell 2.4% in June to a 4.09 million SAAR, though they remained up 2.8% from a year earlier, and the national median reached a record $440,600, a 36th consecutive year-over-year increase (NAR, released July 9, 2026). Seasonally adjusted annual rate, or SAAR, annualizes a single month's pace so months compare cleanly. Inventory stood at 4.6 months, still below the 5-to-6-month range generally considered balanced. The forward-looking signal is weaker: NAR's Pending Home Sales Index dropped 5.4% to 72.5, the lowest reading since January and down 0.3% year over year, with month-over-month declines in all four regions.

Key Risk: Inflation improved and rates rose anyway. That divergence suggests the mortgage market is pricing term premium and Fed-path uncertainty rather than near-term inflation, which means a further CPI improvement may not translate into meaningfully lower mortgage rates. June's pending sales drop is the cleanest early warning in this issue: it points to softer closings in August and September, after the summer selling season peaks.
California Market Analysis
CA median price (Jun '26)
$904,640
▼ −2.8% MoM; +0.4% YoY
Sales SAAR (Jun '26)
279,880
▲ +4.1% MoM; +6.0% YoY
Median time on market
23 days
▼ from 24 days a year ago
Unsold Inventory Index
3.1 mo
Jun '26; from 3.8 mo a year ago
Sales-to-list ratio
100.0%
vs 99.3% in Jun '25
CA Zillow all-property
$775,549
▼ −0.4% YoY
2026 price forecast
$905,000
C.A.R. full-year target
California statewide median home price, C.A.R. monthly (Aug 2025 to Jun 2026)
C.A.R. SFR median ($K)
2026 full-year forecast ($905K)
Sources: C.A.R. Monthly Sales & Price Reports (Aug 2025 to Jun 2026, June release dated July 16, 2026); C.A.R. 2026 Housing Market Forecast (Sept 2025). April 2026 was revised down to $909,410 from $914,810 and May to $930,260; September 2025 is unverified and shown as a gap.

California closed the first half of 2026 with the healthiest sales figure in six months. Closed escrow sales of existing single-family homes reached a 279,880 SAAR in June, up 4.1% from May's revised 268,810 and up 6.0% from June 2025, the third consecutive year-over-year gain and the strongest since September 2025 (C.A.R., released July 16). Year-to-date sales are up 1.9% through the first half. Statewide sales have now run below the 300,000 benchmark for 45 consecutive months, so this is a recovery within a depressed range rather than a return to normal volume.

What makes the June sales figure more encouraging than April's or May's is where the growth came from. C.A.R. reports that gains were driven primarily by entry-level and mid-tier homes, while higher-priced sales retreated for a second straight month. For the past two quarters this report has flagged that California's record medians were substantially a composition effect, meaning the median rose because the mix of homes sold tilted upmarket rather than because typical homes were appreciating. June is the mirror image: the share of million-dollar-and-above sales fell from a record 38.5% in May to 36.9%, and the statewide median fell 2.8% to $904,640 even though it remains 0.4% above a year ago. A median that falls because ordinary buyers came back is a healthier signal than a median that rises because they left.

Supply moved the other way. The C.A.R. Unsold Inventory Index (UII, the months it would take to clear all listed homes at the current sales pace) fell to 3.1 months in June from 3.8 a year earlier, and active listings were down 10.4% year over year, the fifth consecutive annual decline and the steepest since December 2023. Median time on market was 23 days, down from 24, and the sales-price-to-list-price ratio was 100.0% against 99.3% a year ago. Faster sales at full asking price, with fewer listings, is the classic setup for renewed price pressure in the second half if demand holds.

Methodology Note: C.A.R. tracks existing single-family resales only and runs higher than broader gauges. Zillow's $775,549 statewide figure covers condos and townhomes across all transaction types, and the California LAO's mid-tier estimate is near $775,000. All three are correct for what they measure; the gaps reflect coverage, not contradiction.
Regional Breakdown
Median home price by county, June 2026 ($K)
Source: C.A.R. June 2026 Home Sales and Price Report, county median prices, not seasonally adjusted (released July 16, 2026).
Year-over-year median price change by county (%)
Source: C.A.R. June 2026 Home Sales and Price Report, year-over-year change in county median price. Zero baseline; negative values shown below the axis line.
County Median Price (Jun '26) Price YoY Price MoM Sales YoY Affordability (Q1 '26)
San Francisco$2,128,000+24.8%−3.3%+18.1%20%
Santa Clara$1,950,000−7.6%−7.1%−1.8%22%
Orange$1,490,000+1.4%−0.2%+12.2%16%
Alameda$1,325,000+0.3%−5.4%+1.5%23%
San Diego$1,085,000+5.9%+2.5%+16.1%17%
Los Angeles$910,370+0.7%+8.6%+6.8%18%
Riverside$635,0000.0%−0.8%+7.1%29%
Sacramento$575,000+4.7%+2.6%+18.3%34%
San Bernardino$508,080+5.3%+4.5%+13.1%35%
Fresno$429,820−2.0%−1.2%+14.7%37%

On the columns: This table follows individual counties rather than C.A.R.'s multi-county regions, so the same market is never counted twice. Median price, year-over-year and month-over-month change, and sales growth all come from the C.A.R. June 2026 release. The final column is C.A.R.'s Traditional Housing Affordability Index for the first quarter of 2026, the share of local households that can afford the county median-priced home (higher is more affordable). A one-year price forecast column is deliberately omitted: the only Zillow regional forecast vintage available at publication was dated December 2025, too stale to present as current, and no county-level forecast from a primary source was available. Zillow's current national outlook is a 0.2% decline in U.S. values over the twelve months to May 2027.

The coastal Bay Area is pulling in two directions. San Francisco's median jumped 24.8% year over year to $2,128,000, which C.A.R. attributes to AI-driven demand, an acute inventory shortage, and tech-equity gains lifting buyer net worth; San Mateo rose 7.9% and Marin 7.6%. At the same time Santa Clara fell 7.6% to $1,950,000 with sales down 1.8%, the only major coastal county losing ground on both price and volume, and Napa fell 17.3%. Alameda was essentially flat at $1,325,000.

San Diego, Orange, and the inland counties turned in the broadest gains. San Diego led the large coastal counties on price at $1,085,000, up 5.9% with sales up 16.1%, and Orange reached $1,490,000, up 1.4% with sales up 12.2%. Inland, San Bernardino rose 5.3% to $508,080 on 13.1% more sales, while Riverside was flat at $635,000 even as sales rose 7.1%, consistent with more entry-level product clearing. Los Angeles County sat at $910,370, up just 0.7% year over year.

The Central Valley and Sacramento remain the volume and affordability leaders. Sacramento County sales rose 18.3% with the median up 4.7% to $575,000, and Fresno sales rose 14.7% even as its median slipped 2.0% to $429,820. These are the counties where the largest share of households can still afford the local median, from 34% in Sacramento to 37% in Fresno, against 16% to 23% across the coastal counties. Statewide, the median time on market was 23 days and the sales-to-list ratio was 100.0%; C.A.R. does not publish those two measures at the county level.

Affordability & Mortgage Payment Burden
Share of CA households able to qualify, by home tier (LAO)

Single index: California LAO tier-qualification share, 2019 vs 2026

Bottom-tier '19
57%
Bottom-tier '26
46%
Mid-tier '19
31%
Mid-tier '26
23%
Source: California LAO Housing Affordability Tracker, 1st Quarter 2026 (published April 20, 2026), the latest edition available. Correction: the 2019 mid-tier share is 31%, not the 35% shown in prior editions. Single-index chart; C.A.R.'s separate Housing Affordability Index appears in the lock-in callout.
Monthly rent vs. ownership cost, 2-bedroom CA (LAO estimate)
Median rent
Ownership cost (PITI)
Source: California LAO Housing Affordability Tracker, Q1 2026, March 2026 estimate. PITI = principal, interest, property taxes, and insurance, for a statewide two-bedroom home at prevailing mortgage rates. The LAO does not publish an explicit down-payment assumption for this series, and it is a statewide estimate rather than a market-by-market figure.
Lock-in Effect: The LAO reports that about 77% of California homeowners hold mortgage rates below 5%, against a market rate now near 6.5%. A homeowner selling and rebuying a comparable home at current rates would face monthly payments roughly 11% higher, about $180,000 more over a 30-year loan. That is the single largest structural reason listings fell 10.4% year over year in June despite genuinely stronger demand. Separately, C.A.R.'s Housing Affordability Index (HAI), a different measure, reached a four-year high in the first quarter of 2026 as rates eased, and C.A.R. forecasts an 18% full-year 2026 index against 17% in 2025 and 16% in 2024. Affordability is improving from a very low base, not becoming good.
Distressed Properties & Rental Market
CA filings (H1 '26)
21,543
▲ +12.8% YoY (ATTOM)
CA foreclosure starts (H1)
16,040
▲ 3rd highest state
CA bank repossessions (H1)
2,644
▲ 2nd highest state
CA foreclosure rate (H1)
1 in 680
0.15% of units; 18th nationally
U.S. filings (Q2 '26)
115,714
▲ +15% YoY; −3% QoQ
Avg days to foreclose
563
Q2 '26; lowest since 2013
U.S. foreclosure filings, quarterly trend
Total filings (thousands)
Source: ATTOM U.S. Foreclosure Market Reports. Q1 2026 (118,727) and Q2 2026 (115,714) directly reported; Q2 2025 (100.6K) derived from ATTOM's reported 15% year-over-year change and revised from the 94K shown in prior editions; earlier quarters derived from reported half-year and year-over-year totals.
Average asking rent, selected CA markets (Zillow)
All bedrooms, all property types
Statewide
Source: Zillow Rental Manager market averages, all bedrooms and all property types, city level plus statewide, last updated July 13, 2026. City-level geography throughout for comparability.

For the first time in several editions this report can publish California distress figures rather than describe the trend qualitatively. ATTOM's Mid-Year 2026 report counted 21,543 California properties with a foreclosure filing in the first half of 2026, up 12.8% from a year earlier, covering 0.15% of housing units, or one in every 680. That ranked California 18th nationally by rate, well behind Florida at 0.27% and South Carolina at 0.26%, so California's problem is one of absolute volume rather than intensity. Within that volume, California recorded 16,040 foreclosure starts, third nationally behind Texas and Florida, and 2,644 bank repossessions (REO, property a lender takes back after foreclosure), second nationally. Bakersfield posted the fourth-worst metro foreclosure rate in the second quarter at one in every 616 housing units.

Nationally the picture is one of gradual normalization rather than distress. Filings totaled 227,548 in the first half, up 21% year over year, but second-quarter filings of 115,714 were down 3% from the first quarter even while up 15% from a year earlier. The average time to complete a foreclosure fell to 563 days in Q2, the shortest since 2013 and a seventh consecutive quarterly decline. Shorter timelines mechanically raise completion counts without implying more borrowers are failing, which is the main reason REO volume is growing faster than filings. California is a non-judicial foreclosure state, so its process moves from a Notice of Default (NOD, the first formal step) to REO faster than judicial states, and first-half starts should surface as completions later in the year.

Rents continue to diverge sharply by market. Zillow's statewide average asking rent was $2,700 as of mid-July, up $5 on the month but down $100 year over year, while San Francisco averaged $4,295 and Sacramento $1,995. The rent-versus-own gap documented by the LAO, with ownership running about 66% above rent on a comparable two-bedroom home, keeps rental demand structurally firm regardless of what for-sale prices do.

California's statewide rent cap under AB 1482 follows a standing formula: 5% plus the regional change in CPI, capped at 10%. For the adjustment window beginning August 1, 2026, the cap in the Los Angeles-Long Beach-Anaheim CPI region is 8.7% (Apartment Association of Greater Los Angeles), and Marin County's is 8.8% on an April 2026 regional CPI of 3.8% (County of Marin). These are near the top of the range seen in recent years, a direct consequence of the spring energy-driven CPI run-up. Owners and tenants in covered units should confirm the figure for their own CPI region, since it varies materially across the state.

New Construction & Permits
U.S. housing starts (SAAR, thousands), monthly July 2025 to June 2026
Total starts
Single-family starts
Source: U.S. Census Bureau / HUD New Residential Construction, through June 2026 (released July 17, 2026). April and May figures reflect Census revisions: April total revised to 1,392,000 from 1,465,000, May to 1,199,000 from an initial 1,177,000.

June's headline was dramatic and largely hollow for the for-sale market. Total housing starts rebounded 19.0% to a 1,427,000 SAAR after a weak May, but the entire gain came from multifamily, which jumped 76.3% to a 513,000 rate, the highest in more than three years. Single-family starts were 895,000, essentially flat against May's revised 897,000 and below the 1,022,000 reached in March. Single-family construction has been range-bound near 900,000 for a year, which is the number that matters most for entry-level for-sale supply.

Multifamily strength is not irrelevant to California. More apartment completions in 2027 and 2028 would ease the rent pressure that the AB 1482 caps above are responding to, and rental supply is the faster lever in a state where the lock-in effect keeps resale listings scarce. On the California permit picture specifically, state-level authorization counts for June were not available from Census or the Construction Industry Research Board at publication, so no figure is presented here rather than an estimate. The structural reforms remain the bigger California story: the AB 130 and SB 131 CEQA exemptions took effect January 1, 2026, and their measurable effect on permits and completions will take several more quarters to appear.

Policy & Legislative Developments
SB 79: now in effect

Signed October 2025; took effect July 1, 2026. Applies immediately in Alameda, Los Angeles, Sacramento, San Diego, San Francisco, San Mateo, and Santa Clara counties, raising height and density standards near major transit stops and overriding local zoning. Cities have split: Los Angeles adopted the most restrictive option available, delaying full implementation to 2030; Los Angeles, San Francisco, and San Jose are pursuing industrial employment hub exclusions; Menlo Park adopted the law after rejecting a staff recommendation to seek an exemption.

CEQA & permitting reform

AB 130 and SB 131 were signed and took effect January 1, 2026: expanded CEQA exemptions for qualifying infill and housing projects, shortened agency review timelines, caps on public hearings, and limits on the administrative record in litigation. The first major CEQA reform in a decade.

Rent caps & ADU reforms

AB 1482 caps reset August 1, 2026 at 5% plus regional CPI to a 10% ceiling, producing 8.7% in the Los Angeles CPI region and 8.8% in Marin. On ADUs (accessory dwelling units), AB 976 permanently ended owner-occupancy requirements, AB 434 mandates pre-approved plans, SB 1211 allows additional ADUs on multifamily lots, and AB 1033 lets cities permit separate condo sale. All signed and in effect.

Insurance Wildcard: Carriers have continued to restrict writing in fire-prone California counties, pushing more owners onto the FAIR Plan at materially higher cost. These premiums never appear in median-price statistics, but they reduce buyer budgets dollar for dollar and tighten lender underwriting, compounding the rate and price pressures above.
Outlook & Forecast
30-Day: July 2026
Closings Strong, Contracts Weak
June closings were the best in six months, but June contracts fell 5.4% nationally to a six-month low. Because pendings lead closings by roughly 30 to 60 days, expect July and August California closed sales to give back part of June's gain. Watch the July 28-29 FOMC meeting, C.A.R.'s July data in mid-August, and whether the Freddie Mac weekly rate holds below 6.6%.
60-Day: August 2026
Supply Becomes the Binding Story
With the UII at 3.1 months, listings down 10.4% year over year, and the sales-to-list ratio at 100.0%, the second half sets up as a supply-constrained market rather than a demand-constrained one. AB 1482 caps reset August 1 at 8.7% to 8.8% in major regions, which should support rental cash flow. SB 79 applications begin landing in the seven covered counties, though Los Angeles has deferred most of its effect.
90-Day: Fall 2026
$905K Forecast Looks Well Calibrated
The statewide median has printed $909,410, $930,260, and $904,640 over the last three months against C.A.R.'s $905,000 full-year target, so the forecast looks well calibrated rather than optimistic. Expect oscillation in the low $900Ks, with the mix of homes sold driving more of the monthly movement than underlying values. Central Valley, Sacramento, and the Inland Empire remain the likeliest volume upside; Santa Clara and Napa the likeliest sources of year-over-year softness.
What This Means for You
Homeowners
If you hold a sub-5% mortgage, the math still favors staying: trading into today's rate near 6.5% costs roughly $180,000 over 30 years on a comparable home. If you do need to sell, June's conditions were favorable, with homes moving in 23 days at 100% of list. Confirm your fire insurance status early, because coverage problems now derail more California escrows than financing problems.
Agents
Your buyer pool broadened in June: gains came from entry-level and mid-tier homes while million-dollar sales fell from 38.5% to 36.9% of the market. Price to the region, not the statewide median, since the Bay Area was flat year over year while the Central Coast rose 6.9%. With listings down 10.4% year over year, listing appointments are worth more than buyer appointments this quarter.
Brokers & Lenders
Inflation fell to 3.5% and mortgage rates still rose, so underwrite to higher-for-longer rather than to a coming easing cycle; the Fed removed its 2026 cut from the June dot plot. California produced 16,040 foreclosure starts and 2,644 REOs in the first half, and with average timelines down to 563 days that pipeline converts faster than it used to. Bakersfield, Vallejo, and Stockton style markets warrant closer collateral review.
Investors
Ownership costs run about 66% above rent on a comparable two-bedroom, which keeps rental demand structurally strong, and the August 1 AB 1482 reset allows 8.7% to 8.8% increases on covered units in major regions. Central Valley and Sacramento offer the best entry economics, with sales up 13.8% and 18.3% and medians still near $515,000 and $575,000. Model financing at 6.5% or higher, not at hoped-for rates, and watch the growing California REO pipeline for acquisitions.
Key Indicators to Watch Next Month
  • July FOMC decision (July 28-29) and any shift in the dot plot
  • C.A.R. July 2026 closed sales, median, and UII (mid-August)
  • NAR July existing home sales and pending sales index
  • July CPI: whether core holds near 2.6%
  • Census July housing starts and permits, single-family in particular
  • CA NOD filings: Los Angeles and Bay Area county recorders
  • Freddie Mac weekly PMMS: whether the climb past 6.58% continues
  • AB 1482 caps taking effect August 1 and local ordinance overlays
  • SB 79 application volume in the seven covered counties
Glossary
SAAR
Seasonally Adjusted Annual Rate: a month's sales pace annualized and adjusted for seasonal patterns, so months compare cleanly.
PITI
Principal, Interest, Taxes, and Insurance: the full monthly cost of owning, not just the loan payment.
NOD
Notice of Default: the first formal step in the foreclosure process, recorded when a borrower falls behind.
REO
Real Estate Owned: property a lender takes back after a foreclosure that did not sell at auction.
DOM
Days on Market: the median time from listing to pending sale.
UII
Unsold Inventory Index: the months it would take to sell all listed homes at the current sales pace. Lower means tighter supply.
HAI
Housing Affordability Index: C.A.R.'s measure of the share of households that can afford a median-priced home.
Basis point
One-hundredth of a percentage point. 46 basis points equals 0.46%.
Composition effect
A shift in the median caused by a change in which homes sold (for example, more or fewer high-end sales), rather than by individual homes changing value.
5.0 Based on 72 Google reviews
  • I've worked with North Coast Financial several times on trust loans and bridge loans, and they've been great every time. Jeff Hensel and Don Hensel are both amazing to work with.
    Jeff is always very responsive and willing to look through different scenarios with me. They're quick, straightforward, and will let you know right away if they can help. Their turn times are also very fast, which makes a huge difference on these types of loans.
    Every client I've referred to them has been happy with the experience. They're dependable, trustworthy, easy to reach, and genuinely helpful. I highly recommend North Coast Financial.

    Katy Care July 2026
  • We had an excellent experience working with North Coast Financial, and especially with Jeff Hensel. Our situation involved a complicated trust loan, with a number of moving pieces and questions along the way. Jeff was consistently responsive, patient, and approachable. He took the time to explain the process clearly, answer our questions, and walk us through each step.
    What stood out most was his availability and calm professionalism. During what could have been a stressful and confusing process, Jeff helped make things understandable and manageable. We are grateful for his guidance and would gladly recommend North Coast Financial to others dealing with trust, estate, or specialized lending needs.

    Konstantin Kotopoulos July 2026
  • I normally don't leave reviews but the experience I just had dealing with Jeff was remarkable to say the least. The way business is supposed to be done. They funded and closed on an investment property I purchased in 7 days flat. No nonsense just got it done. I would highly recommend North Coast Financial and Jeff to anyone needing these type of services. Will be back very soon. Thank you Jeff.

    tom bolyard July 2026
  • Don at North Coast Financial is a phenomenal rock star at his trade! He took charge from day one, kept the entire process simple, and moved everything forward with speed and confidence. He never overwhelmed me or bombarded me with unnecessary details. He communicated clearly, only when it mattered, and always with total professionalism.
    He shoots from the hip in the best possible way! Direct, honest, and efficient. I trusted his credibility and workflow completely, and he delivered exactly what he promised. The entire experience was smooth, stress‑free, and genuinely impressive.
    Don made my dream home happen. I’ll absolutely work with him again and refer him to anyone who wants a lender who gets things done the right way. Thank you guys at NCF!

    Kim July 2026
  • Five-Star Review: Don Hensel Closed my $1.75M Loan in 5 Days!
    I am writing this to give my highest possible five-star recommendation to Don Hensel and the North Coast Financial team.
    I needed to close a $1.75 million loan purchase in just five days. After hearing my situation, Don stated he could make it happen and fund it in that timeframe—and he delivered exactly as promised.
    From our first conversation, Don proved to be an excellent listener who truly understood my unique needs. He was compassionate, helpful, and offered strategic suggestions that made all the difference. I provided him with the necessary information, and he along with his expert processing team handled the rest with remarkable efficiency and honesty.
    The level of professionalism was so high that my real estate agent, the seller’s agent, and several escrow officers all went out of their way to tell me how impressed they were with Don’s work. It is rare to find a lender who earns that kind of praise from every professional involved in a high-stakes transaction.
    If you are looking for a five-star private lender who combines deep expertise with genuine integrity and lightning speed, Don Hensel is the best in the business. Thank you to Don and his entire office for making this happen!
    Charles & Latonia

    Latonia Anderson April 2026
  • I had an excellent experience working with North Coast Financial, Inc. on a hard money loan for my mother’s trust. Jeff and Don Hensel were clear, responsive, and highly professional throughout the entire process. Documentation was handled quickly, communication was consistent, and—most importantly—funding was extremely fast. From start to finish, the process took approximately two weeks. I am very pleased with the experience and would confidently recommend them to anyone in need of hard money or trust-related loan services.

    Patrick Willette January 2026
  • I had a great experience working with North Coast Financial. Dan and Jeff were very responsive and made the loan process straightforward from start to finish. Jeff consistently followed up and kept me informed every step of the way through clear email communication, which I really appreciated. Everything has gone smoothly, and I only have positive things to say about the entire experience.

    Cecilia Escalon August 2025
  • I reached out to North Coast for a loan. Long story short, it turns out we didn’t need it. Jeff helped me sort through contradicting advice I was getting elsewhere, even though it meant we wouldn’t be using his services. I appreciated his knowledge and integrity and would gladly recommend North Coast to others

    Kevin Weinert June 2025
  • Jeff and Don were incredible professionals that helped me to save the home I've owned for 23 years. They found smart solutions to complex problems under tight time constraints. They are both trustworthy experts that guided me wisely in making difficult choices. If you have an opportunity to work with them, do it.

    CallMeDarcy May 2025

About North Coast Financial, Inc.

North Coast Financial has experience funding hard money loans across California since 1981. With over $1 billion in loans funded, we have a ground-level view of how California real estate markets shift across cycles, rate environments, and regional conditions.

This monthly analysis is written for borrowers, investors, brokers, and fiduciaries who need a clear picture of where the California market stands today. We focus on the data that matters most to real estate transactions: price trends, inventory, days on market, and lending conditions.

North Coast Financial is a direct hard money lender based in Oceanside, CA. We lend on residential and commercial real estate statewide, with loan approvals available the same day and funding within 7 days for business purpose scenarios. Questions about a specific deal? Call (760) 722-2991 or email contact@northcoastfinancialinc.com.
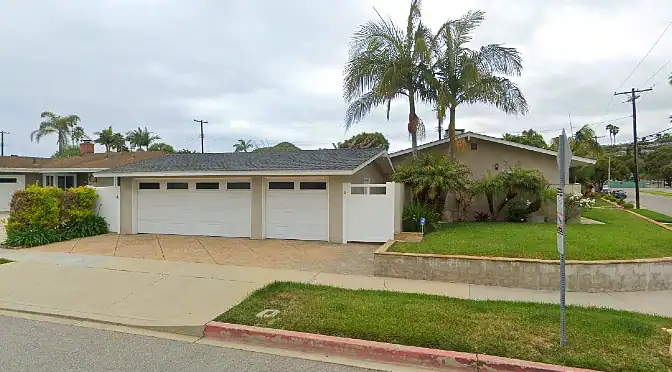
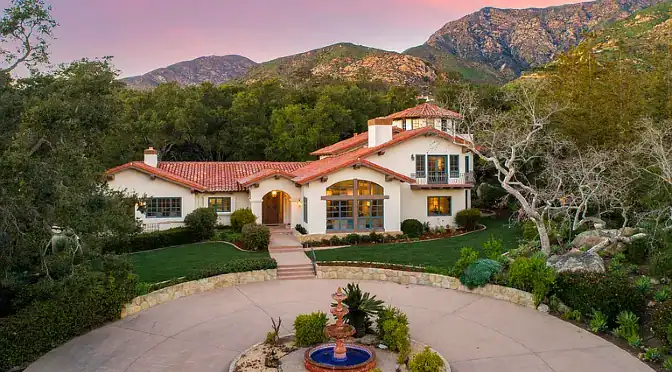
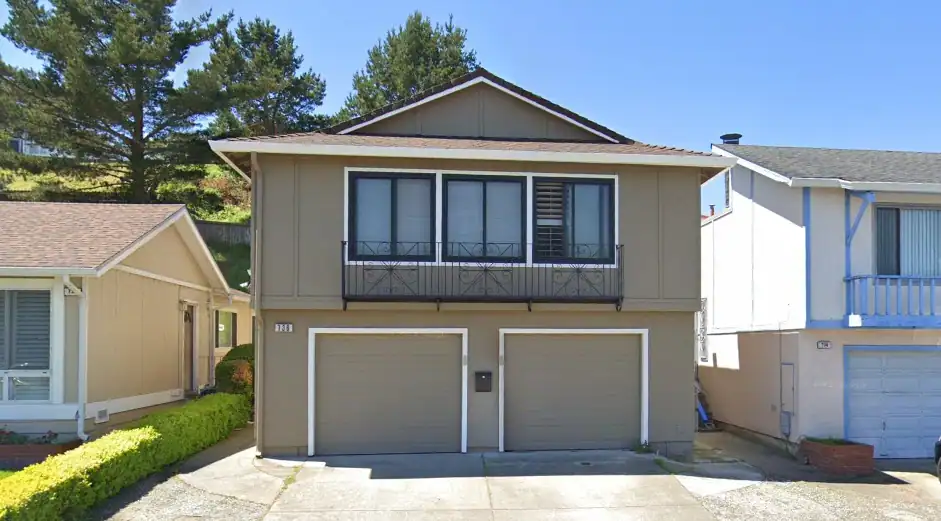
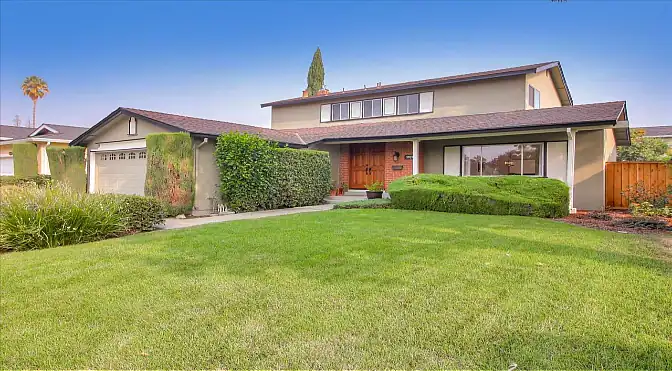
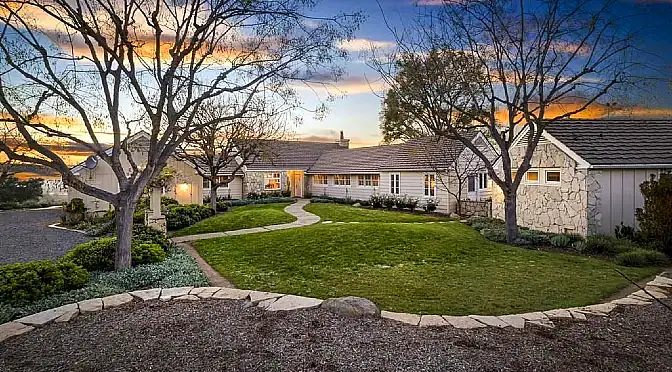
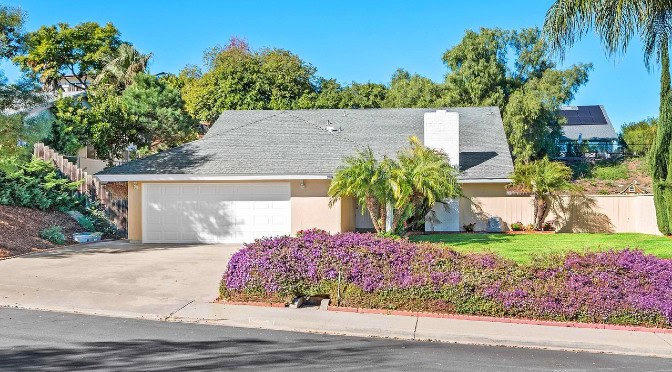
Recent Hard Money Loans Funded by North Coast Financial